gputaskman 0.4.4 Makes Local GPU Memory Easier to Explain, but Its Measurements Still Need Context
gputaskman is an open-source terminal monitor that connects GPU memory and engine activity to processes, runtimes, model files, and LLM buffers. Its latest release is useful for debugging local AI workloads, provided you treat estimates and cross-platform gaps honestly.

Windows Task Manager can tell you that a GPU is busy. It is much less reliable at answering the question that usually follows: busy doing what?
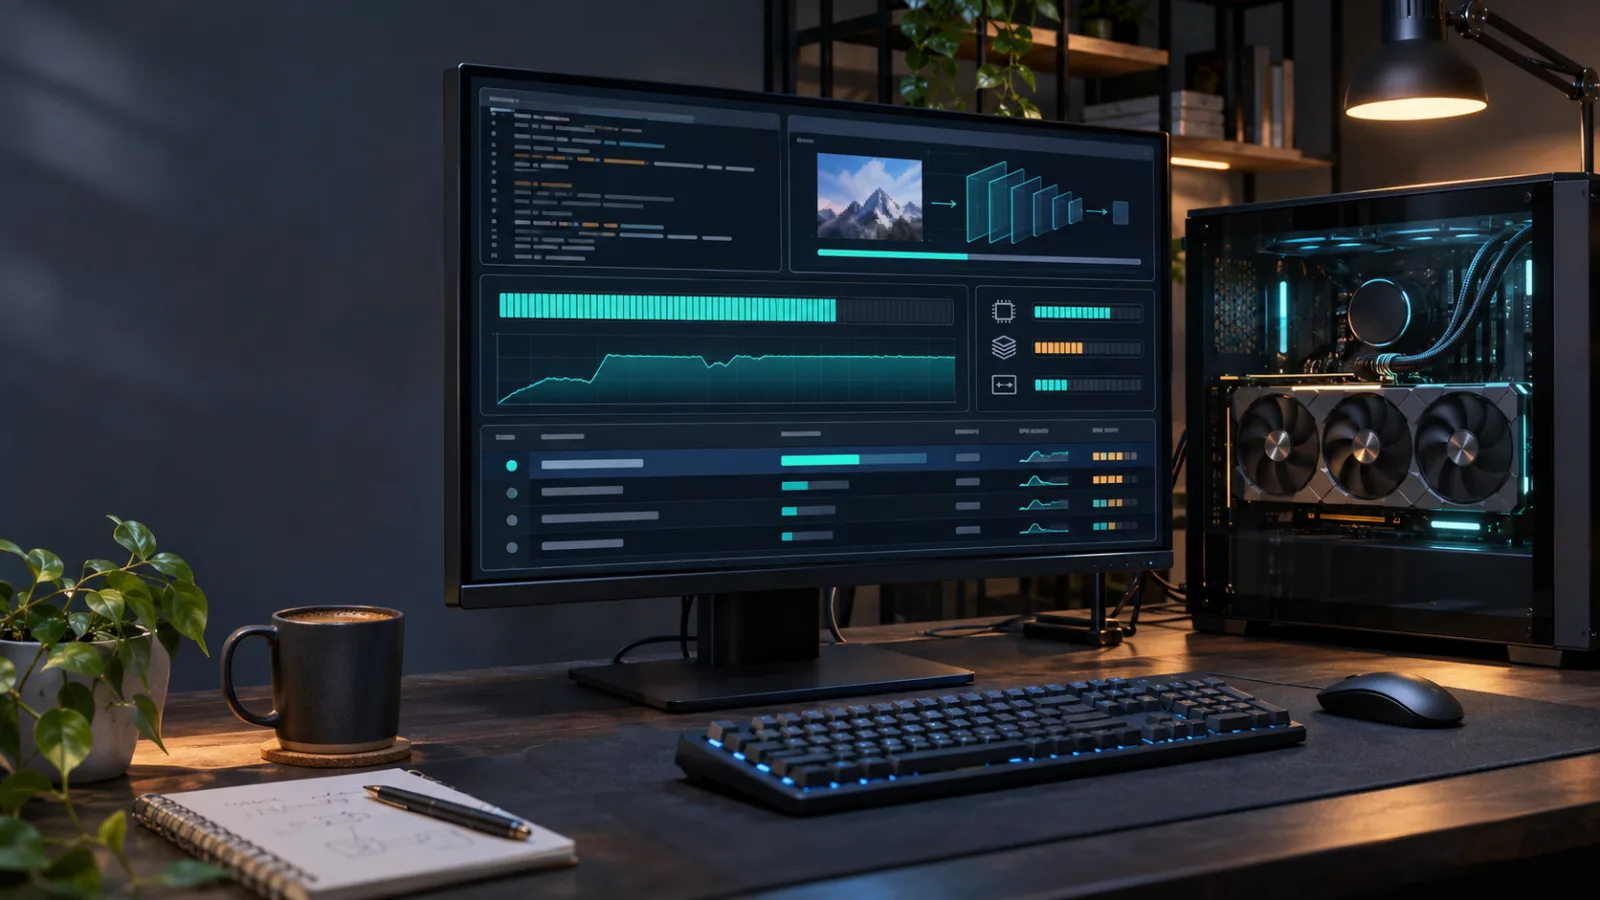
That distinction matters more now that a desktop GPU may be serving a browser, a game, a video decoder, a local language model, a compositor, and several background runtimes at the same time. A single VRAM total does not tell an operator whether the pressure comes from model weights, a KV cache, a window surface, a driver allocation, or a process that has simply kept memory reserved.
gputaskman is a small open-source project aimed at that gap. It presents a terminal interface for per-process GPU memory, engine activity, loaded runtimes, model paths, and selected local-LLM details. The project’s latest tagged release, 0.4.4, was published on November 17, 2026. That release adds macOS compressed graphics memory to the Paged column, resolves relative model flags against a target process’s working directory, documents that Apple Foundation Models run on the Neural Engine rather than the GPU, and adds detection for NVIDIA MCDM compute GPUs through NVML.
The useful angle is not that gputaskman replaces every vendor monitor. It does not. Its value is that it tries to put hardware counters and application evidence in the same view, while being unusually explicit about which values are measured, inferred, or estimated. That makes it worth testing for local AI debugging and GPU experiments. It also makes the limitations impossible to ignore.
What changed in 0.4.4
The 0.4.4 release is a maintenance-and-coverage release rather than a complete redesign. The macOS change is particularly practical: compressed graphics memory now appears in the Paged column. On Apple Silicon, “GPU memory” is not the same kind of isolated VRAM pool found on a discrete graphics card. Unified memory and compression can make a simple used-versus-free number misleading, so showing the paged or compressed part is useful when investigating pressure.
The release also fixes a less visible but important source of wrong model names. A command line may contain a relative model path, but that path is relative to the target process’s current working directory, not necessarily the directory from which the monitor was launched. Resolving the flag against the target’s working directory improves the chance that the displayed model path points to the file the process actually opened.
The project also documents a boundary that is easy to miss in a local-AI dashboard: Apple Foundation Models use the Neural Engine for their inference path, so a GPU monitor should not be expected to attribute that work to the GPU. Finally, NVIDIA MCDM compute GPUs can now be discovered through NVML. That is relevant to newer Windows compute-oriented hardware, although support detection is not the same as broad hardware validation.
The previous 0.4.x releases show the direction of the project. Version 0.4.2 added runtime-reported request and KV-cache gauges from vLLM metrics, llama-server metrics for KV-cache usage and request concurrency, AMD GPU support in WSL through ROCm AMD SMI, recording summaries, offline playback, and early Intel Xe process-memory and cycle accounting. Version 0.4.1 added more explicit provenance for custom model paths, Intel activity from Windows WDDM counters, Snapdragon Foundry Local model identification, Qualcomm shared-memory reporting, and fixes for integrated-GPU process accounting.
That sequence is important. gputaskman is not merely polling one vendor API and renaming the result. It is assembling a cross-platform evidence layer, and every new backend adds another set of definitions that users must understand.
The problem it is trying to solve
A conventional GPU monitor often begins with device-wide values: total memory, used memory, utilization, temperature, clocks, and power. Those are useful for capacity planning and incident diagnosis, but they do not automatically explain ownership.
For a local language model, the memory footprint may include model weights, a KV cache, allocator reserves, runtime overhead, mapped files, and buffers shared with other processes. The amount allocated by the runtime is not necessarily the amount actively resident on the GPU, and a model path appearing in a command line does not prove that the corresponding model is currently loaded or being exercised.
gputaskman’s design tries to keep those distinctions visible. Its README describes process memory and engine activity as measurements when the operating system and driver expose them. Runtime, command-line, and model-file information are supporting evidence. GGUF-derived breakdowns and similar classifications are estimates. The project explicitly warns that seeing a PyTorch or CUDA DLL is not enough to identify a model or prove that training is taking place.
That is a healthier model for a diagnostic tool than presenting every field as equally authoritative. A dashboard that labels a guess as a measurement can be worse than a dashboard that leaves a field blank.
The interface is aimed at local workloads rather than cloud services. It covers more than LLM inference: the documented scope includes decision models, vision, speech, training and fine-tuning, graphics, and video. CPU-only work, NPU-only work, and cloud inference are outside that scope. In practical terms, it can help answer questions such as:
- Which process is responsible for the GPU memory increase?
- Is the visible workload a browser, compositor, game, video process, or local model runtime?
- Does a model server expose enough runtime information to show request concurrency or KV-cache use?
- Which counters are unavailable because of the operating system, driver, permissions, container boundary, or backend?
- Did a workload’s memory usage grow between two snapshots, and what part of that comparison is only an estimate?
Those are operational questions, not benchmark questions. gputaskman is most useful when the user already has a concrete mystery to investigate.
What is measured, and what is inferred
The project’s strongest documentation is its explanation of uncertainty. On Windows, WDDM exposes information that has no exact equivalent on every other platform, including shared-memory and commit-related counters. On native Linux, NVIDIA data comes through NVML and other hardware paths; AMD and Intel use different mechanisms. On macOS, Apple Silicon has unified memory and compressed graphics memory rather than a conventional dedicated-VRAM model.
The differences affect what a row means. Native Linux can report per-process memory for processes visible to the user and can use NVML for process-level engine readings when those counters are available. It cannot simply reproduce Windows spill and paged columns, so unavailable values remain blank or null rather than being shown as zero. That distinction prevents an operator from mistaking “not measured” for “nothing happened.”
WSL is harder still. The Linux process and the Windows host process do not share a simple identity from the perspective of every GPU API. The project marks some rows with symbols such as * or ? when ownership is matched or guessed. In containerized environments, host PIDs reported by NVML may not correspond to the container’s /proc numbering. gputaskman can use process-order and library-mapping evidence to suggest a pairing, but its own documentation says that such a pairing does not prove ownership.
This is why the project distinguishes measured VRAM from inferred bytes. A guessed row may display a candidate value as a hint, but it is not treated as a measured process peak or a reliable model budget. Engine percentages can also be unavailable for Linux processes inside WSL because host engine counters do not establish which local process performed the work.
The same caution applies to model memory. A model can allocate lazily. A runtime can retain freed allocations in a cache. A request can change the KV cache without causing a proportional change in dedicated memory. The project’s documentation describes a comparison in which a larger context setting produced a substantially larger estimated KV-cache requirement while measured dedicated memory grew by much less. That is not a contradiction; it is a reminder that estimated model components and physical allocations answer different questions.
For a diagnostic workflow, the right habit is to read the evidence labels before acting on the number. A measured process counter can support a decision to stop a process. An inferred model attribution should prompt another check. An estimate can guide an experiment, but should not be treated as a capacity guarantee.
A practical first test
The simplest way to try gputaskman is through an isolated tool installation:
uv tool install gputaskman
gputaskman
The project also documents a pipx route and provides portable builds for Windows and Linux. Python 3.11 or newer is required for the package installation path. Windows users can download a portable ZIP, keep the _internal directory beside the executable, and run commands such as:
.\\gputaskman.exe
.\\gputaskman.exe --once
.\\gputaskman.exe --json
The portable Windows build does not require the CUDA Toolkit, Visual Studio, an administrator session, an API key, or a model download. It does require a supported GPU and a current Windows WDDM driver. The project notes that these builds are currently unsigned and that an installer is not part of the initial distribution. The releases include companion SHA-256 files, but users still need to obtain the archive from the project’s release page and verify that the extracted layout has not been altered.
A sensible test is to establish a baseline with the desktop idle, then start one known workload. For example, run a local model server or a GPU benchmark, wait until it has completed at least one request or scene, and compare the process list with the baseline. Do not begin by assuming that the largest number is the most interesting one. Check whether the row is using dedicated memory, shared memory, paged memory, or an inferred attribution. Note whether the runtime and model name came from a command line, a mapped file, a metrics endpoint, or a heuristic.
The one-shot JSON mode is useful when the terminal display is too transient. The project also supports recording a session as JSON Lines:
uv run --locked gputaskman record --gpu 0 --interval 5 --duration 300 -o session.jsonl
A recording can be summarized later or compared with another snapshot. This is a better fit for workloads whose memory profile changes over time, such as model loading, context growth, overnight inference, training, or a game that streams assets. The documentation says a snapshot of 52 processes is roughly 27 KB, so a one-second interval can grow to around 100 MB per hour. Longer intervals are more practical for extended runs.
Recordings should be treated as potentially sensitive data. The project warns that snapshots can include paths, command-line flags, model names, and local ports. A JSON file that looks like harmless performance telemetry may reveal a user name, a private project path, an internal service, or the exact local model in use. Review and scrub a recording before sharing it in an issue or forum.
Who should try it
The clearest audience is someone running local AI on a workstation and trying to understand the relationship between the process, the runtime, and the memory graph. Developers working with llama.cpp or llama-server, vLLM, local model runners, PyTorch, or similar stacks can use it to correlate a runtime’s own metrics with operating-system counters. The added vLLM and llama-server gauges are particularly useful when a model server exposes information that a generic process monitor cannot infer.
GPU developers and hardware testers are another good fit. The tool supports snapshot, JSON, recording, diff, and summary workflows that are more useful for repeatable experiments than a screenshot of a live terminal. Someone investigating a mixed Windows, WSL, Linux, or Apple Silicon environment can also use it as a way to see which metrics disappear at a platform boundary.
It is less compelling if the only requirement is “show me total NVIDIA memory use.” nvidia-smi, vendor utilities, Windows Task Manager, Activity Monitor, and established platform monitors already cover many basic cases. gputaskman earns its place when the user needs process-level context, runtime evidence, or a cross-platform view of local workloads.
It is also not a replacement for a profiler. It does not dump VRAM, enumerate every game texture, prove that a model is resident, or explain kernel-level performance. It can identify that a process is using GPU resources and can sometimes connect that process to a model or runtime. It cannot turn limited driver telemetry into perfect causal attribution.
The risks of overtrusting a friendly dashboard
The project is marked as early and experimental. That is not a ceremonial disclaimer. Hardware support varies by backend, operating system, driver, permissions, container configuration, and GPU generation. Some paths are tested by contributors and not repeated by the maintainer. Some hardware combinations are covered by fixtures or documentation but not by a broad live validation program.
The release history shows rapid expansion across Windows, Linux, WSL, macOS, AMD, Intel, NVIDIA, Huawei Ascend, Qualcomm, and newer Windows compute paths. That pace is encouraging for an open-source project, but it also means that “supported” should not be read as “equally mature everywhere.” A successful launch on one RTX card says little about an Intel multi-GPU machine, an AMD card inside WSL, a container with multiple PID namespaces, or an Apple Silicon workload using compressed unified memory.
There are also security and supply-chain considerations. The repository is MIT-licensed, which makes inspection, modification, and redistribution straightforward. The releases publish checksums and include licenses. But the Windows portable builds are currently unsigned. Users should treat a binary utility that reads process and hardware information with the same care they would apply to any downloaded executable: use the official repository, verify the checksum, inspect the release version, and prefer a source or package installation that fits the local trust model.
The tool itself reads sensitive local information in order to do its job. Command lines, mapped libraries, model paths, ports, and process metadata can reveal more than a user expects. This is particularly important when using the recording feature in support requests or public bug reports. A safe diagnostic workflow includes a data-review step before upload.
Finally, model attribution can create false confidence. A filename is evidence of a possible model; it is not proof of residency. A GGUF-derived size breakdown is an estimate; it is not a driver allocation report. A runtime DLL is a clue; it is not proof of the workload’s purpose. The project is explicit about those limits, but a polished terminal interface can still make a tentative answer feel definitive.
Alternatives and how to choose
For NVIDIA-only troubleshooting, nvidia-smi remains the direct baseline. It is mature, scriptable, and close to the vendor’s own telemetry, although it does not aim to explain every application-level model detail. Windows Task Manager is already adequate for a quick check of which processes are using a GPU, especially when the question is simply whether a browser or game is active.
On Linux, tools such as nvtop provide an established interactive view for supported GPUs. Vendor utilities and desktop monitors may offer better integration with a particular operating system. Profilers are more appropriate when the question is kernel performance, memory bandwidth, synchronization, or application-level latency rather than ownership of a memory total.
gputaskman occupies a narrower middle ground: more contextual than a raw vendor counter, less invasive and less specialized than a profiler. Its differentiator is the attempt to join process telemetry with runtimes, model files, and local-LLM buffers while keeping uncertainty visible. That makes it a useful complement to existing tools, not a universal replacement.
The verdict
gputaskman 0.4.4 is worth trying if local GPU workloads have made memory accounting confusing. The latest release improves Apple Silicon visibility, path resolution, and hardware discovery, while the broader 0.4 series adds runtime metrics, recording, summaries, and wider backend coverage. The project also does something many monitoring tools avoid: it explains where a number came from and when the number is only a guess.
That transparency is the reason to test it. A user who wants a single authoritative answer for every GPU, runtime, container, and model should wait. A user who wants a practical investigation aid can install it beside existing monitors, reproduce one workload, capture a baseline and an after-state, and compare the measured fields with the estimated ones.
The central advice is simple: use gputaskman to ask better questions, not to stop asking questions. If it says that a process owns measured VRAM, verify the process and the workload. If it suggests that a model explains a buffer, check the provenance. If a column is blank or null, read that as missing evidence rather than zero usage. For an early open-source diagnostic tool, that discipline is more valuable than a denser dashboard.
Comments
Sign in to comment.
No comments yet.