November 10-Meter FT8 Openings: Turn a Short Propagation Window into a Useful Station Test
Recent autumn conditions have made 28 MHz unexpectedly productive, even without extreme solar flux. Here is a disciplined way to test the opening, compare paths, and avoid mistaking a quiet band or a forecasted Kp rise for an antenna fault.
A useful 10-meter opening does not always arrive with a dramatic solar headline. The current autumn pattern is a better reminder: around 28 MHz, a modest solar flux near 110, quiet geomagnetic conditions and the right time of day can be enough to produce long-distance FT8 decodes. The Radio Society of Great Britain’s November 6 propagation report describes late-afternoon FT8 signals from Brazil, Argentina and Ecuador on 28.074 MHz, with the possibility of a solar flux increase toward 120 before easing back. It also warns that a large coronal hole could push the planetary K index toward 4 during the weekend. RSGB propagation report
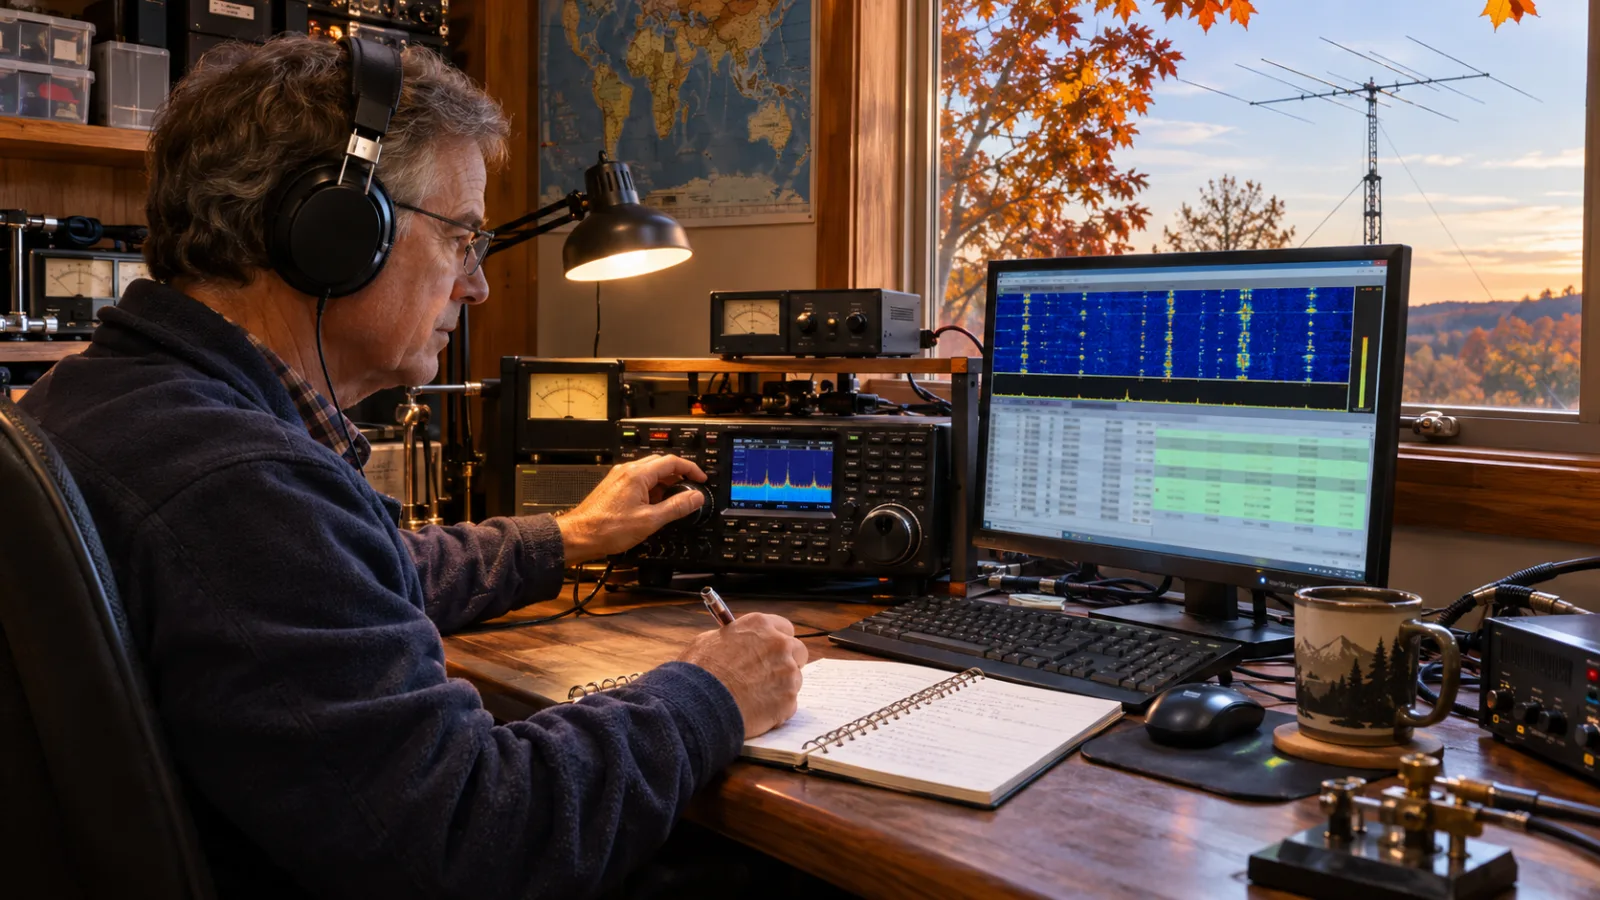
That combination creates a practical operating question rather than a prediction contest: how can an operator tell whether a brief 10-meter opening is genuinely useful from their station? The answer is to treat the opening as a controlled observation window. Log what you hear, make a small number of legal and repeatable transmissions, compare the result with another band, and record enough timing and signal information to separate propagation from equipment problems.
What the current pattern actually says
The important detail in the RSGB report is not simply that “10 meters is open.” It is that the opening is time-dependent and directional. The report places many of the described FT8 signals in the late afternoon and notes that north–south paths may be less affected than polar paths if geomagnetic activity increases. That is a useful operating hypothesis, not a guarantee for every locator or antenna.
A solar flux index around 110 is supportive of upper-HF activity, but it does not provide a band-by-band forecast. The flux value is a broad indicator of solar ultraviolet output and ionospheric ionization. It cannot tell you whether a particular path will be open at your location, whether absorption will dominate, or whether a local noise source will hide weak signals. The same caution applies to Kp: a rising value indicates disturbed geomagnetic conditions, but it does not translate directly into “all HF is dead.” Path geometry, local time, season, latitude and the band’s maximum usable frequency still matter.
NOAA’s three-day geomagnetic product provides deterministic three-hour Kp forecasts alongside Ap values and storm-level probabilities. It is useful for planning a monitoring session, but the forecast should be treated as a changing input. Check the issuance time and compare it with observed conditions rather than copying a single number into a log and treating it as a verdict. NOAA three-day geomagnetic forecast
For an operator in mid-latitudes, the immediate takeaway is simple: keep 10 meters in the scan even when the solar numbers look ordinary, and do not abandon the band merely because a minor geomagnetic disturbance is expected. A forecasted Kp increase is a reason to test different paths and times, not a reason to assume the antenna has failed.
A 45-minute 10-meter observation plan
Start with receive-only work. Set the receiver or transceiver to the normal FT8 frequency for the band, commonly 28.074 MHz for the 10-meter FT8 segment, and allow the software to decode for at least 10 to 15 minutes before changing anything. The current WSJT-X guide describes FT8 as a weak-signal mode using 15-second transmit/receive sequences. That timing makes it possible to build a useful sample quickly, but it also means that a badly synchronized computer clock, an overloaded audio path or an incorrectly configured sound device can produce misleadingly empty results. WSJT-X User Guide
Record the UTC start and end times, your locator, antenna type, approximate power setting if you later transmit, and the number and origin of decodes. Do not count only the most distant station. A useful observation includes the distribution: continents or regions heard, strongest and weakest signal reports, whether stations are calling CQ or completing contacts, and whether the pattern changes as local sunset approaches.
Next, compare 10 meters with one lower band without changing the rest of the station. Twenty meters is a practical reference for many stations, although the best comparison depends on your antenna and local noise. The comparison does not need to be simultaneous to the second. A ten-minute receive sample on 28 MHz followed by a ten-minute sample on 14 MHz can show whether the apparent 10-meter failure is actually a band-specific condition or simply a software, feed-line or noise problem affecting everything.
If the station is working correctly and you are licensed for the relevant band and mode, make a short, controlled transmission period. Use the normal FT8 operating conventions, stay within the permitted band segment for your jurisdiction, and keep the transmitter’s audio level clean. Two or three minutes of ordinary calling or answering is enough to test whether remote receiving stations report your signal. There is no technical benefit in running excessive power to force a result, and doing so can create distortion or exceed local power limits.
Finally, check the reception reports after allowing for delay. PSK Reporter collects digital reception reports so operators can see where their signals are being heard and use the data to study propagation. It is a valuable second view of the path, but it is not a complete measurement of the ionosphere. A missing report may mean that no suitable receiving station was monitoring, the report has not arrived yet, or your transmission was not decoded. It does not prove that the antenna is incapable of reaching the region. PSK Reporter about the service
What to put in the log
A normal ADIF contact log is not enough if the goal is to learn from a short opening. Add a small propagation note beside the contacts or in a station diary. The minimum useful record is:
- UTC time, band and mode;
- frequency or dial setting, including any software offset;
- your grid locator and the contacted or decoded grid when available;
- signal reports and whether the exchange completed;
- antenna, power and polarization or direction where relevant;
- local noise conditions, especially if an SDR or receiver waterfall changed during the session;
- the solar flux, Kp or other space-weather values you checked, with the forecast issue time;
- the corresponding result on one comparison band.
The purpose is not to create a perfect scientific dataset. It is to avoid the common habit of remembering only the spectacular contact. A single South American decode proves that one path existed at one moment. A sequence of decodes across several minutes, followed by a successful low-power contact and consistent reception reports, tells you much more about the usable window.
Signal reports should also be read in context. FT8 reports are useful for comparing stations within the same session, but a negative report is not a direct measurement of received power at the antenna terminals. Different receivers, noise floors, audio calibration and decoder settings affect the number. Compare like with like: the same band, similar time, similar station configuration and a reasonable number of observations.
How to avoid blaming the antenna too early
When 10 meters suddenly looks empty, check the station in a fixed order. First confirm that the radio is actually on the intended band and that the software is receiving audio. Then look for ordinary FT8 activity from any direction. If nothing decodes on 10 meters but lower bands remain active, inspect the antenna path, feed line, antenna switch and receiver configuration. If every band becomes quiet at once, local noise, audio routing or a software problem is more likely than a sudden failure of the 10-meter antenna alone.
A waterfall can help, but it can also mislead. A visually busy display is not proof of good propagation, and a quiet display can reflect a low-activity period or a narrow receiver passband. FT8 stations do not fill the entire visible spectrum continuously. Keep the receiver centered correctly, verify the expected audio bandwidth, and avoid filtering away the area where stations are operating.
For a directional antenna, repeat the test in at least two headings when practical. A dipole or vertical should not be judged against the same expectations as a beam. The goal is to learn the shape and limitations of the installation, not to compare unlike antennas with a single dramatic map.
Do not turn the test into an antenna-work emergency. Outdoor adjustments, climbing and temporary supports require ordinary electrical and fall-safety precautions. Keep clear of overhead power lines, disconnect equipment during thunderstorms, and do not inspect or modify an antenna while RF can be present. A propagation experiment is not worth an avoidable injury.
What a rising Kp changes—and what it does not
The RSGB outlook links the possible weekend disturbance to a coronal hole and notes that north–south paths may remain more viable than polar paths. That distinction is operationally useful. If geomagnetic activity rises, compare a roughly north–south target with a high-latitude or polar target rather than concluding that all 28-MHz propagation has disappeared.
A disturbed interval can also change the most useful time of day. The late-afternoon pattern described by RSGB may not repeat at the same UTC hour from every location, and a path that worked before a disturbance may weaken afterward. Record local sunrise and sunset alongside UTC. The timing helps explain why two operators can consult the same space-weather report and see different results.
Do not confuse a forecasted G-level storm with an automatic radio blackout. NOAA’s geomagnetic product and its radio-impact products describe different parts of space weather. A geomagnetic disturbance can alter HF conditions, while a solar flare can produce short-lived ionospheric absorption on the sunlit side. For station decisions, inspect the relevant product and the actual decodes rather than collapsing every solar event into one label.
The practical test for this weekend
If you have a working 10-meter antenna, reserve one short session around the late-afternoon period suggested by the current propagation report. Begin with 15 minutes of receive-only FT8 on 28.074 MHz. Log the regions heard and the signal-report range. Compare with 20 meters or another reliable band. If your station is clean and you are authorized to transmit, make a modest, controlled FT8 test and review PSK Reporter after the session. Repeat the same procedure on another day if the band looks promising.
The useful result may be a contact, but it may also be a better diagnosis. You might find that 10 meters opens toward the Southern Hemisphere while a polar path remains absent, that a low-noise receive setup hears more than the antenna’s apparent gain suggests, or that the band is fine and the real problem is a clock, audio or feed-line setting. Those are all actionable findings.
The current autumn conditions are therefore best approached as a measurement opportunity. Solar flux, Kp and propagation bulletins provide context; FT8 decodes, a comparison band and a careful log provide evidence. Treat the forecast as a reason to observe, and let the station’s own data decide what the opening actually meant.
Related articles

Should You Buy Apple’s OLED iPad Mini 8? The $699 Tablet Is for Portability, Not Value
Apple’s new iPad mini 8 finally brings OLED, IP67 protection, and the A20 Pro chip to its smallest tablet. The upgrade is substantial, but the $699 starting price changes who should buy it—and which storage tier makes sense.


Western Sydney International Airport opens on 25 October: the budget access plan for Sydney’s new flights
Western Sydney International starts passenger operations on 25 October 2026, but it will not have a direct train on opening day. Here is how to price the new airport, its buses, launch fares, parking and the extra time needed for early flights.

Los Angeles to Vancouver for $188: the fall budget works only if you price bags, rain and airport transit first
A cheap LAX-Vancouver fare can still make a useful autumn city break, but the real budget depends on Air Canada bag rules, YVR transit add-ons, hotel timing and Vancouver's wet-season backup plan.


My Eicher shows why connected fleet security starts with the API
A published fleet-platform case study points to account, GPS and document exposure risks without needing Hollywood claims about remote truck control.

Comments
Sign in to comment.
No comments yet.